Using the tool
In an era when democracy is under threat from a variety of sources, some of them technical in origin, it is important that young people fully understand how different electoral voting systems reflect the views of voters in different ways. For example a first past the post system with single seat constituencies gives rise to different results than a multi-seat proportional representation system. The way in which constituency boundaries are drawn also has an effect on the results of elections.
This simulation tool will allow the you to configure a national election in different ways, by changing constituency boundaries and electoral voting systems, and to clearly visualize the effects that different choices have on the outcome of the election.
Tooltips & context
Throughout the tool you’ll notice a number of dropdown headers and tooltips which you can click on or hover over to get contextual information related to what you are trying to do.
Selecting your constituency configuration
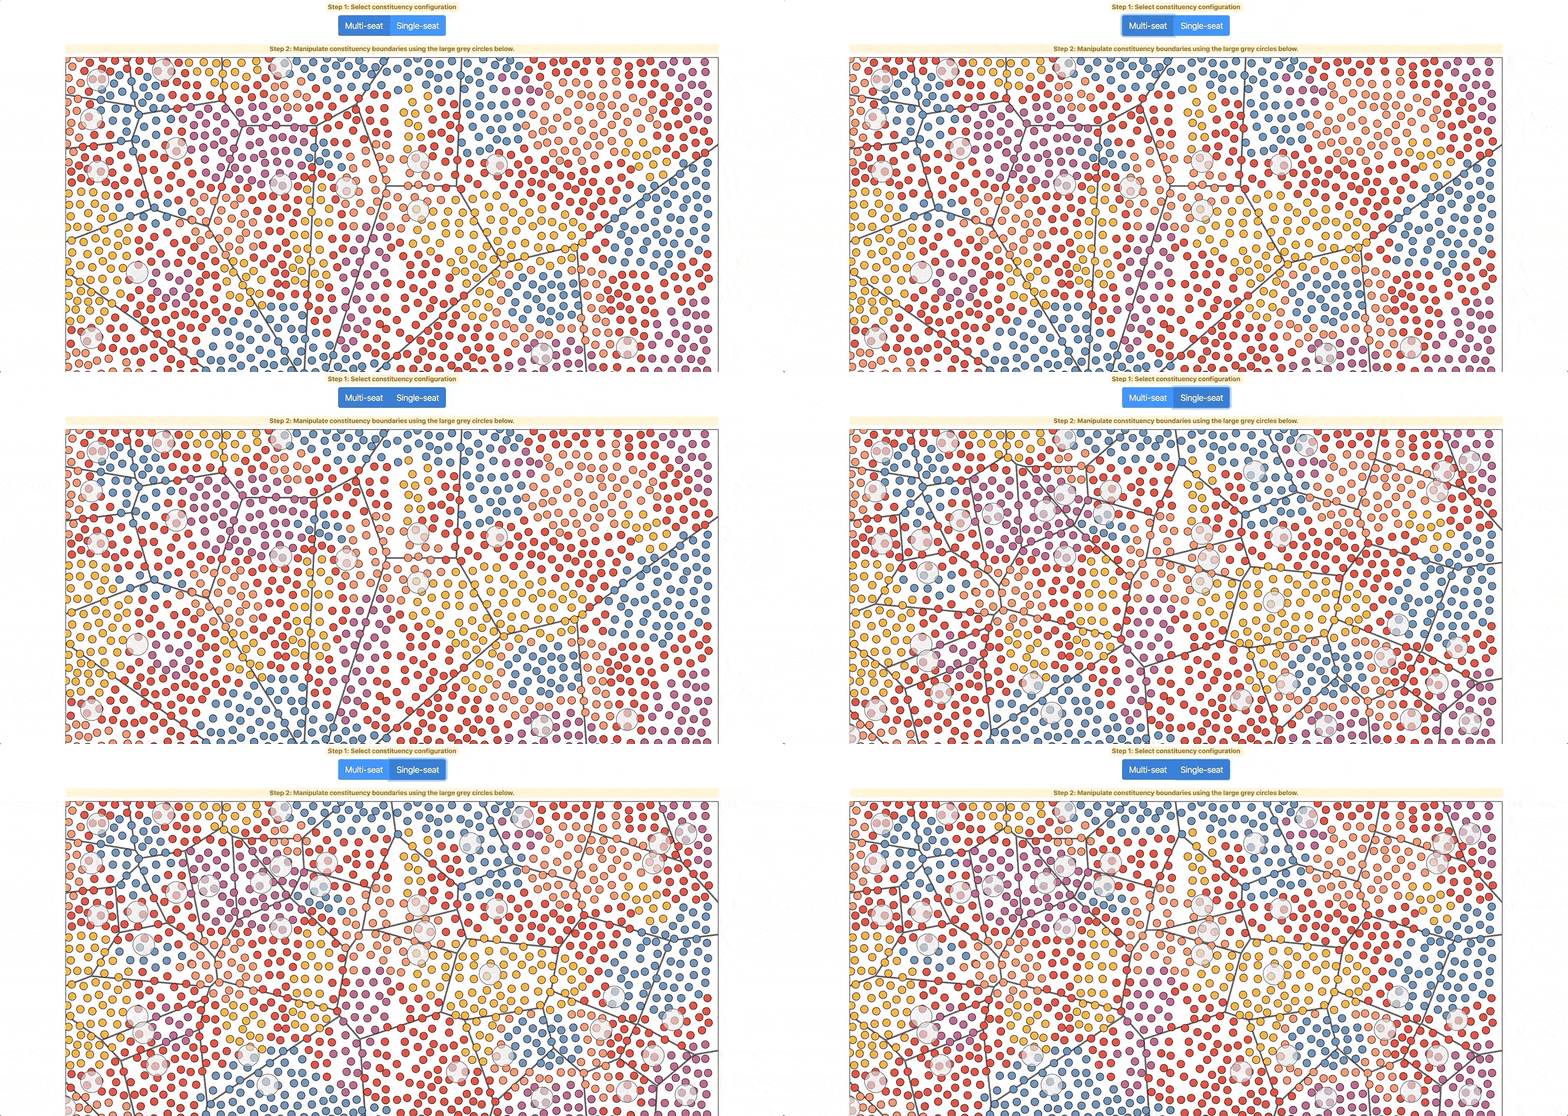
The map represents a set of voters grouped into constituencies or voting areas.
The first step when using the tool is to select your constituency configuration - you’ll notice this changes the number of constituencies in the map. A single-seat constituency is an electoral area electing only one representative to office. A multi-seat constituency is an electoral area electing multiple representatives to office.
As the number of seats for a constituency generally relates to the number of voters in that area, if you opt for single-seat constituencies you will get more, smaller constituencies than if you were to opt for multi-seat.
Voters
Each coloured dot represents a voter of a particular party. Yellow dots are yellow party voters, pink dots are pink party voters and so on. By hovering over these you can also learn the second and third preferences of a voter.
Constituency boundary manipulation
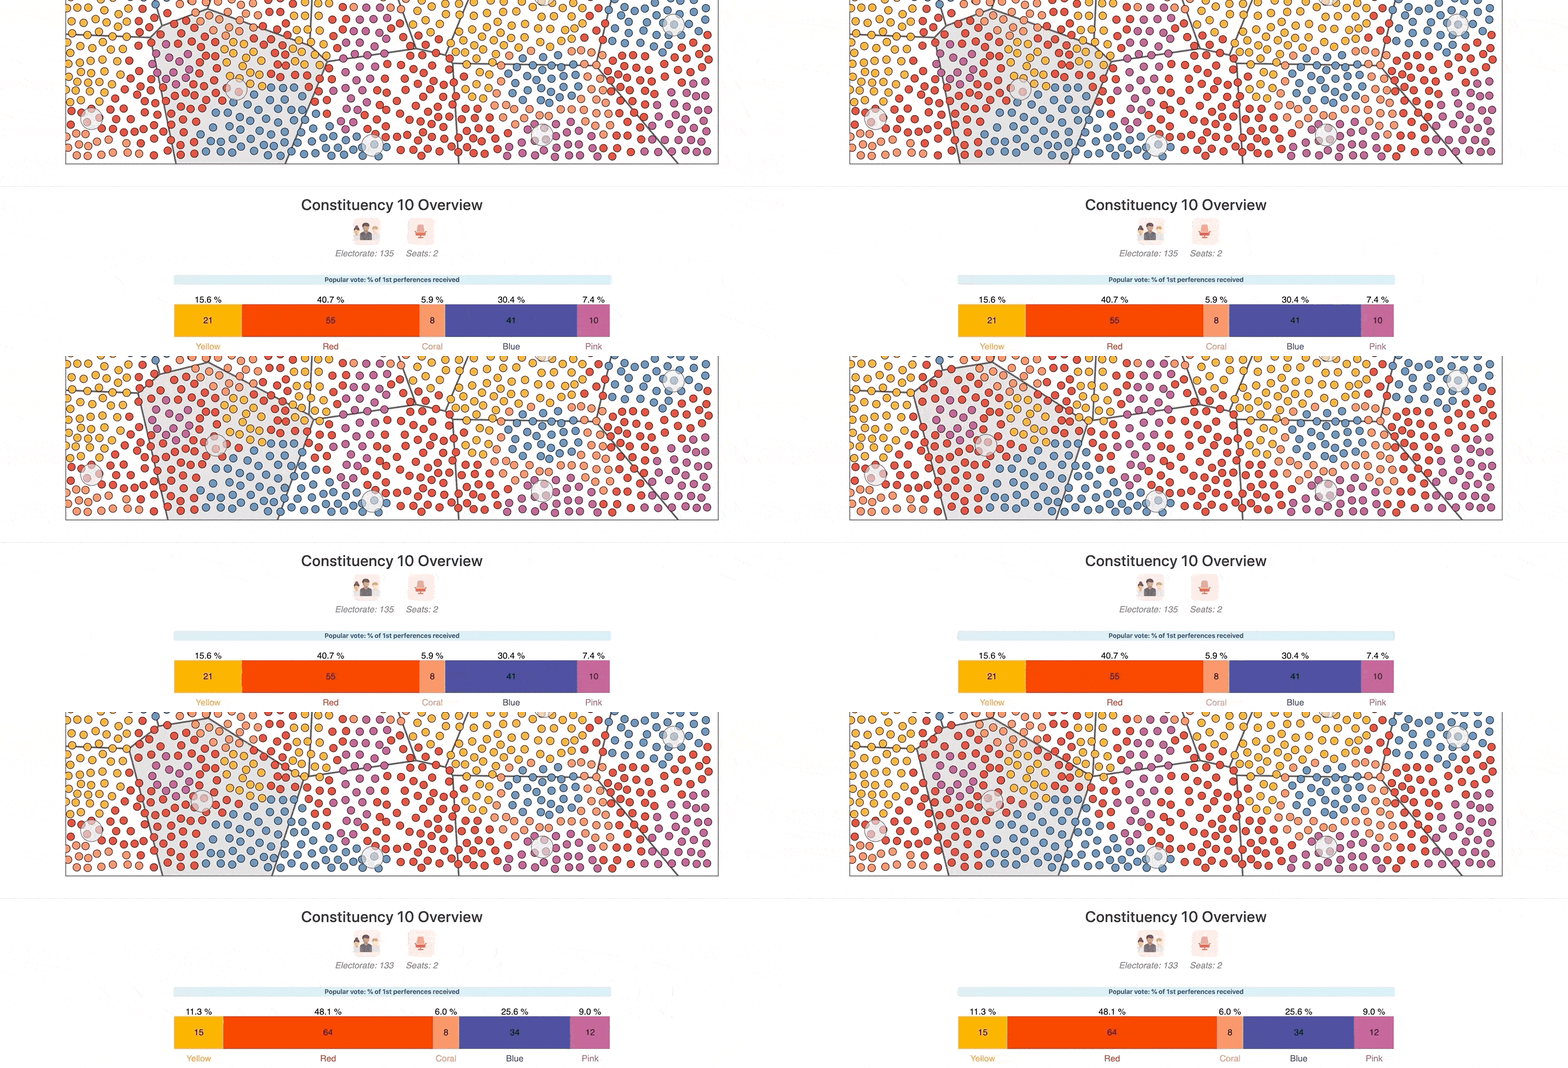
The large grey circles can be dragged to change and manipulate the boundary of each constituency i.e. changing what voters are in the said constituency.
On changing the boundary of a constituency you’ll be presented with an overview of the voter breakdown for that constituency to help you configuring the election as desired. You can also click on a constituency area to select it and see this overview.
Select the electoral system and run the election
First Past the Post and PR-Single Transferable Vote are two types of electoral systems. Selecting one or the other changes how votes are counted and in turn the outcome of the election. Once you have selected your desired system, just hit run. Be sure to try your election out with both.
Results mode
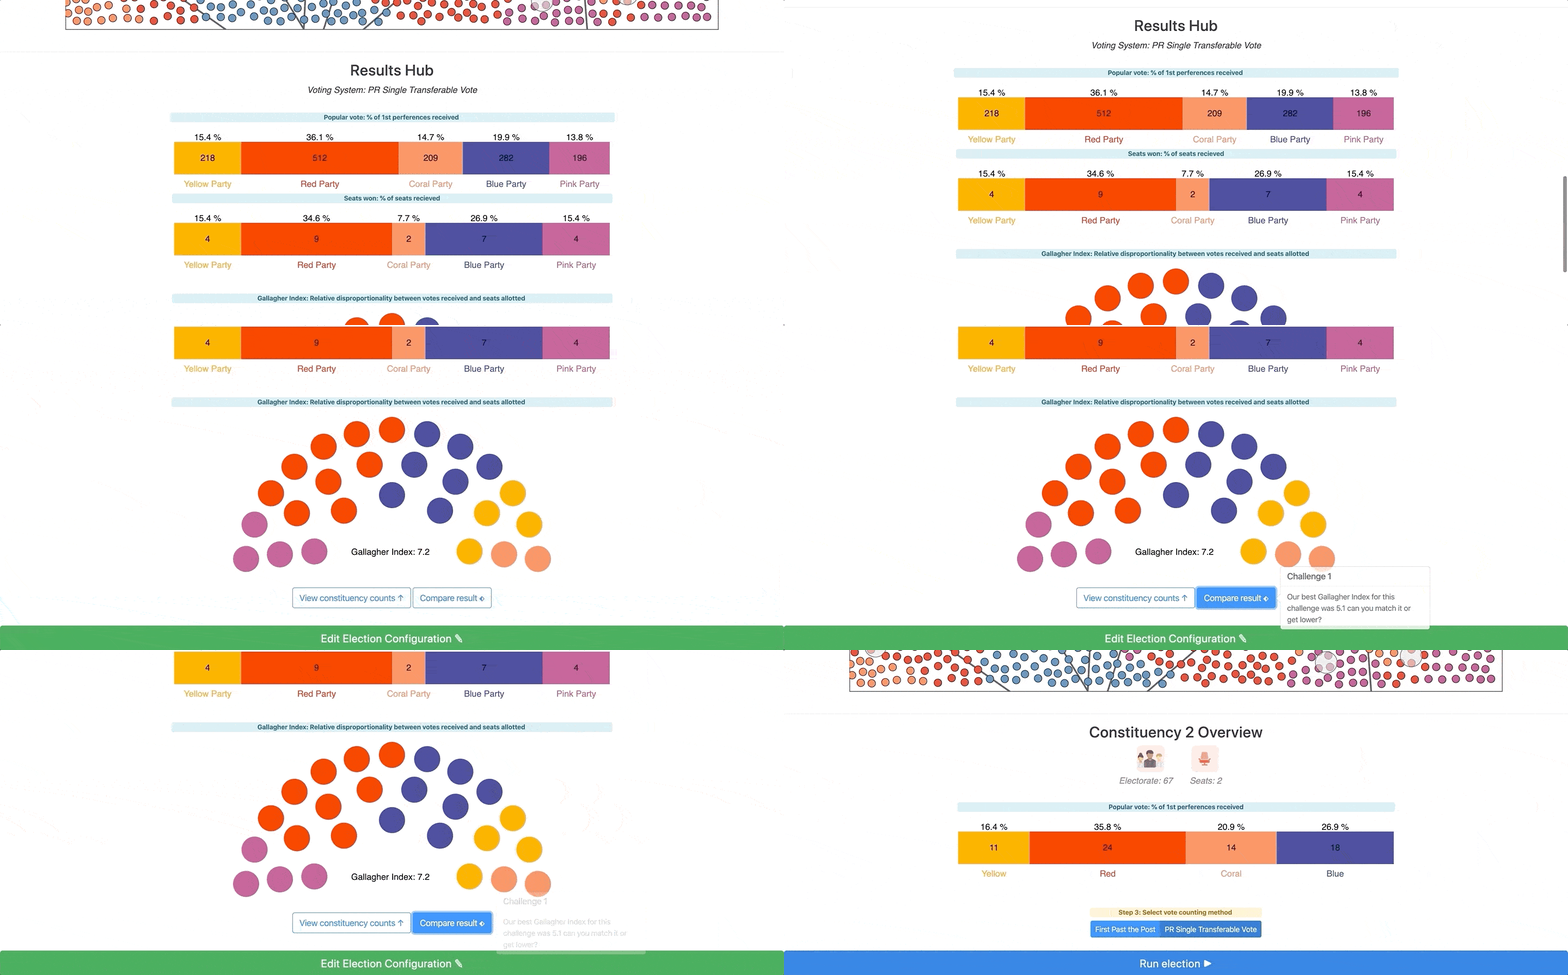
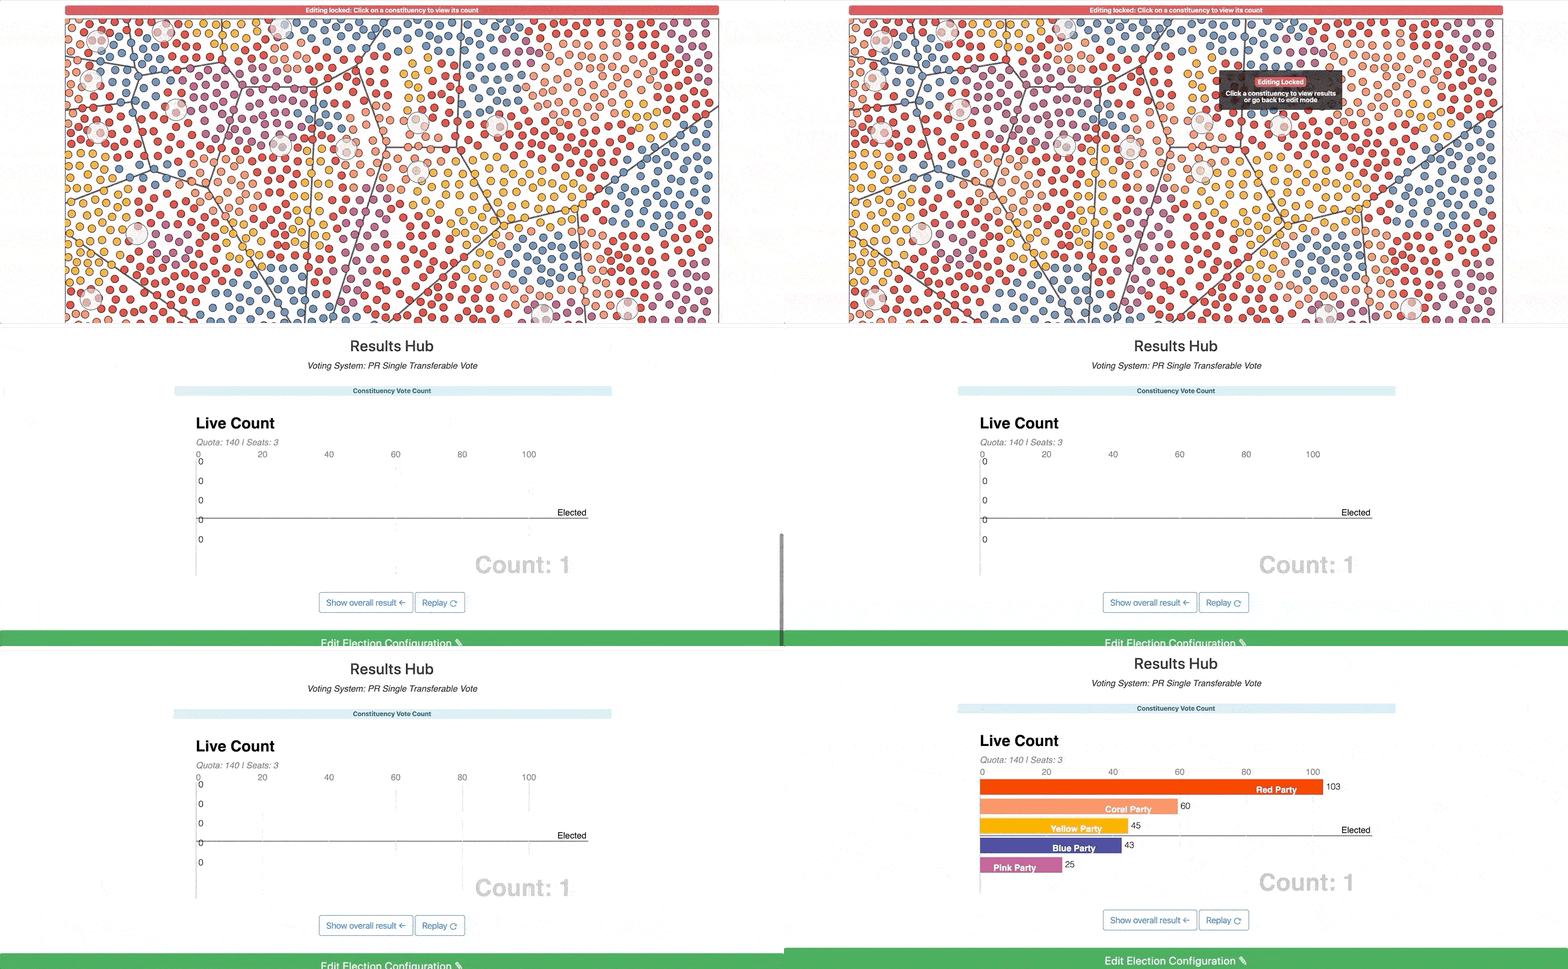
Once you finish designing your election you will be brought to Results mode. In this mode all edits to constituency boundaries, electoral system etc. are locked.
First off you’ll be presented with a range of information about the overall election result for all constituencies combined. The Gallagher index is the key metric here which will allow you to compare your election result for ‘fairness’ across varying configurations. You can quickly go between edit mode and result mode using the large button at the bottom of the screen; allowing to explore what design factors most influence the outcome of an election.
You can also compare your result to the Gallagher index of real elections from Ireland, the US and the UK.
Live election count
Within results mode, you can also delve into more detailed results for each individual constituency. Simply click on your desired constituency on the map, and you will be presented with a ‘Live election count’. This is useful to understand the differences between electoral systems.
Select a challenge
The Gallagher index
At a very high level, the Gallagher Index looks at the ‘fairness’ or proportionality of an election result; a low index being more proportional than a higher index.
A perfectly proportional election is one in which every party wins seats in exact proportion to its share of the votes. A party with 45 per cent of the votes wins 45 per cent of the seats, a party with 5 per cent of the votes wins 5 per cent of the seats, and so on.
Disproportionality, then, refers to the degree to which the actual result deviates from this idea i.e. the difference between the percentage of votes each party gets and the percentage of seats each party gets in the resulting parliament.
The Gallagher index, developed by Michael Gallagher, a Professor in the Department of Political Science in Trinity College Dublin, is the most widely used measure of electoral disproportionality today and allows us to compare levels of disproportionality across lots of elections such as in the below table.
Try comparing the Gallagher index for your election when run using PR-STV and First Past The Post or try comparing your result to results from UK, Irish, and US elections below.
| Year |
Country |
Electoral System |
Gallagher Index |
| 2020 |
Ireland (General) |
PR-STV |
3.17* |
| 2016 |
Ireland (General) |
PR-STV |
9.69 |
| 2011 |
Ireland (General) |
PR-STV |
5.62 |
| 2007 |
Ireland (General) |
PR-STV |
5.85 |
| 2017 |
UK (General) |
FPTP |
6.47 |
| 2015 |
UK (General) |
FPTP |
15.02 |
| 2010 |
UK (General) |
FPTP |
15.13 |
| 2016 |
US (Presidential) |
FPTP (Electoral College) |
9.34 |
| 2012 |
US (Presidential) |
FPTP (Electoral College) |
9.85 |
| 2008 |
US (Presidential) |
FPTP (Electoral College) |
14.24 |
Proportional Representation - Single Transferable Vote
In Ireland, all elections – Dáil, Seanad, presidential, European and local elections – are decided through proportional representation with a single transferable vote (PR-STV).
Voters indicate their first and subsequent choices for the candidates on the ballot paper by marking the relevant number in the box beside a person’s name. You indicate your first choice by writing ’1′ opposite that candidate and ’2′ opposite your second choice, and so on.
By doing so, you are instructing that your vote be transferred to your second preference if your first choice is either elected with a surplus of votes over the quota or is eliminated. If your second choice is elected or eliminated, your vote may be transferred to your third choice, and so on.
When voting people often give their 1st, 2nd and subsequent preferences to candidates of similar ideologies as that’s what they themselves believe in. This results in a phenomena that can see large transfers between certain sets of parties. Some parties are considered to be more transfer ‘friendly’ than others; this simply means that more voters are more likely to give them their second or subsequent preferences. Transfer patterns can often make the difference between winning or losing a seat.
Compare PR-STV with First Past The Post by running your election with each electoral system. Which helps you get your desired result? Which one do you think is fairer?
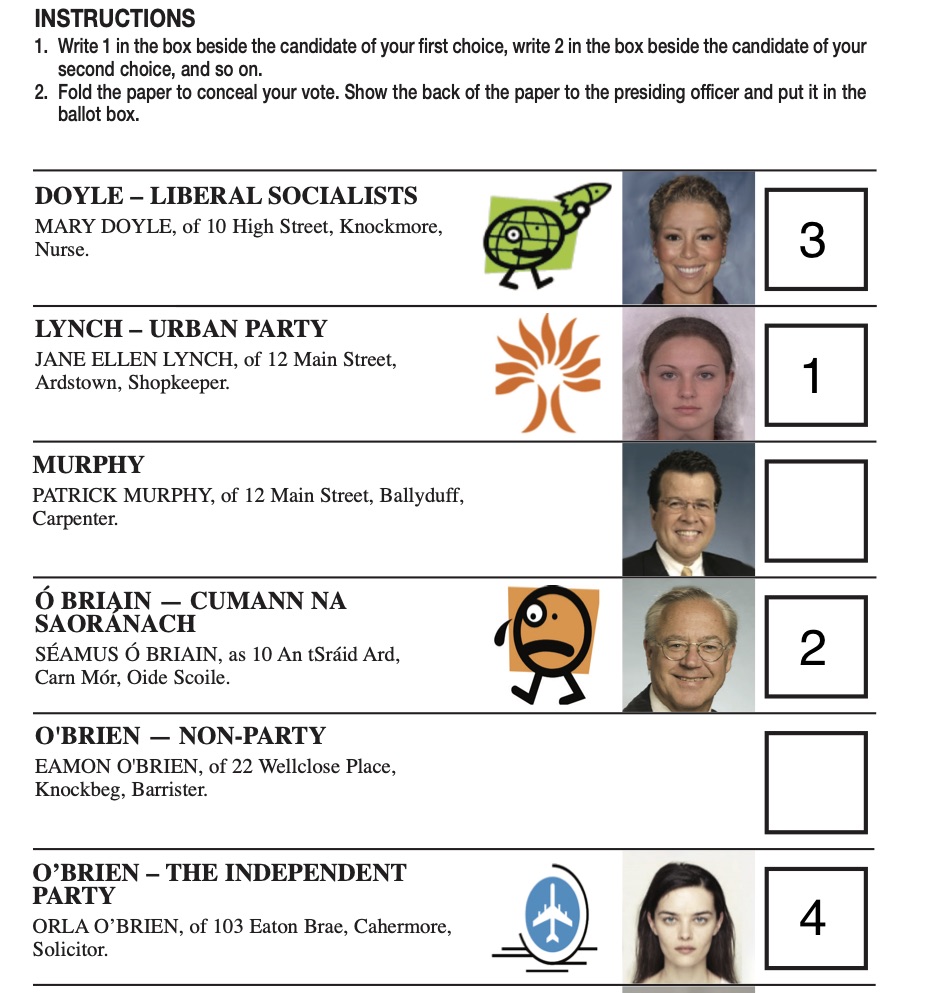
Sample Irish General Election Ballot Paper
First Past The Post
The first past the post system in single-seat constituencies is the second most popular voting system in the world. It’s used in the UK, US, India and Canada. The candidate with the most votes in each constituency gets elected. All other votes are disregarded. This type of voting is also known as plurality voting.
In a multiple-seat version of the first past the post each system each voter casts up to the same number of votes as there are positions to be filled, and those elected are the highest-placed candidates corresponding to that number of positions. For example, if there are three vacancies, then voters cast up to three votes and the three candidates with the greatest number of votes are elected.
Compare First Past The Post with Proportional Representation - Single Transferable Vote by running your election with each electoral system. Which helps you get your desired result? Which one do you think is fairer?
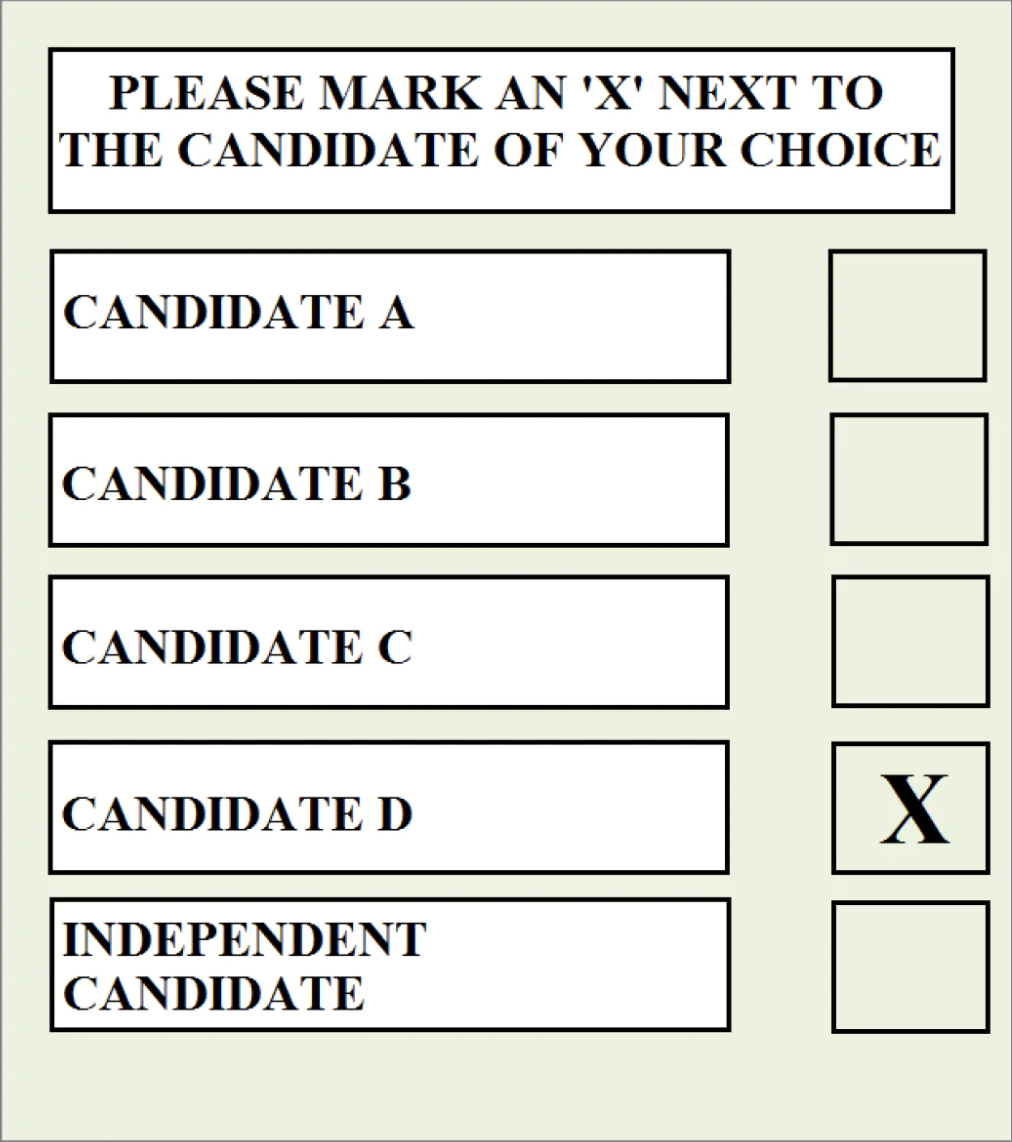
Sample First Past the Post Ballot Paper
Gerrymandering
The proportionality of any electoral system can be arbitrarily manipulated by those in power using a phenomena called Gerrymandering. It is a way governing parties attempt to secure their power in future votes by titling the map of constituencies in their favour. The idea is to use ‘packing’ and ‘cracking’ to draw constituency boundaries in a manner which wins the most seats for the governing party’s candidates. Packing places as many opposition candidates in a constituency as possible so that the governing party can win seats in constituencies around it, while cracking place clusters of opposition voters among several constituencies, so that they will be outnumbered in each constituency.
Try it out by manipulating constituency boundaries in one of the challenges above and checking out the results.

